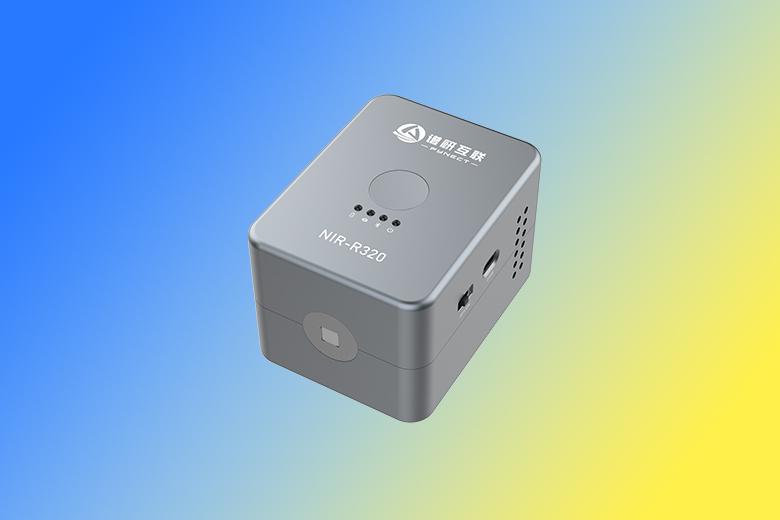
1. Key Features
- Enclosed reflectance-type unit: Built on the NIR-M-R13 module with an added enclosure, Bluetooth, lithium battery and Micro-USB-to-Type-C interface, suited for handheld testing, on-site demonstrations and small-batch application validation.
- Covers the 1600-2400nm band: Suitable for characteristic analysis of food, agricultural, material, chemical and pharmaceutical samples within this band.
- More convenient portable use: The enclosure protects the optical window, circuit board and interfaces, while the lithium battery and Bluetooth suit mobile scenarios.
- More stable contact acquisition: The fixed light source, window and receiving optical path reduce errors from external optical-path setup.
- Supports custom development: Acquisition workflows, model algorithms and customer interfaces can be customized based on the SDK and host software.
2. Specifications
2.1 Technical Parameters
| Item | Parameter |
|---|---|
| Model | NIR-R320 |
| Product type | Enclosed reflectance-type near-infrared spectrometer |
| Internal spectrometer module | NIR-M-R13 |
| Added unit configuration | Enclosure, Bluetooth, lithium battery, Micro-USB-to-Type-C interface |
| Wavelength range | 1600-2400nm |
| Signal-to-noise ratio | 3000:1 @ 2200nm |
| Optical resolution | Typ. 12nm |
| Wavelength accuracy | Typ. ±1 nm |
| Detector | 1mm standard InGaAs (uncooled) |
| Slit size | 1.8mm × 0.025mm |
| Light source | Built-in 3× 0.7W tungsten lamps |
| Measurement mode | Diffuse reflectance / contact reflectance |
| Communication interface | Type-C / Bluetooth BLE (UART expandable) |
| Power supply | USB or lithium battery |
| Power requirement | 5V DC, Min. 1.2A DC |
| Operating temperature | 0-40°C, RH max. 85% |
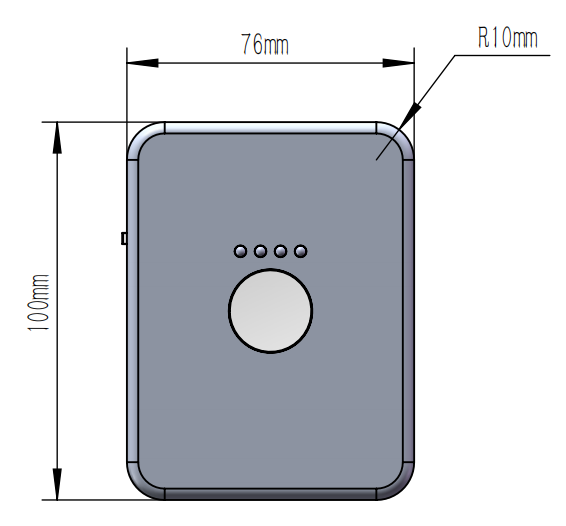
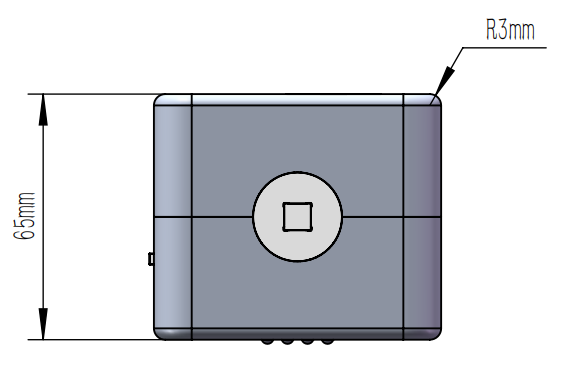
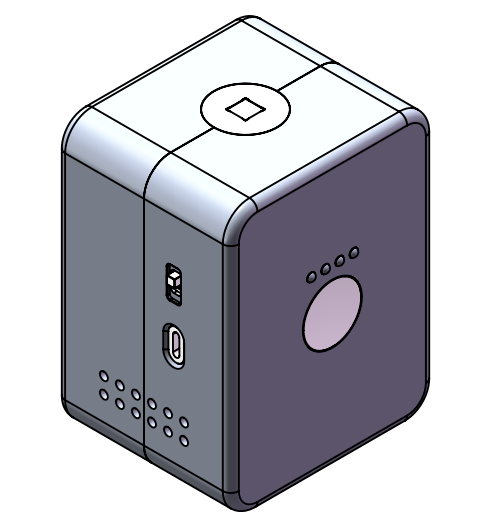
| Dimensions | 100mm × 76mm × 65mm |
| Weight | Depends on the actual lithium battery and enclosure configuration |
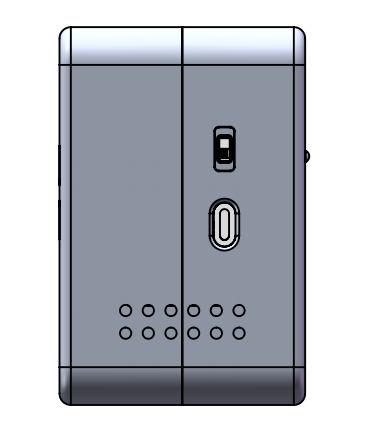
2.2 Structure and Dimensions
3. Applications
The NIR-R320 is suited to reflectance NIR inspection scenarios that require direct handheld testing or customer demonstrations. Compared with a bare-board module, the integrated unit is better suited to frequent movement, on-site sampling, training demonstrations and small-scale project validation.
Typical applications include fruit sugar content and ripeness assessment, grain and feed quality analysis, plastic and textile material identification, pharmaceutical excipient identification, and soil and mineral sample analysis. Actual model performance depends on the number of samples, the accuracy of the reference method and sampling consistency.
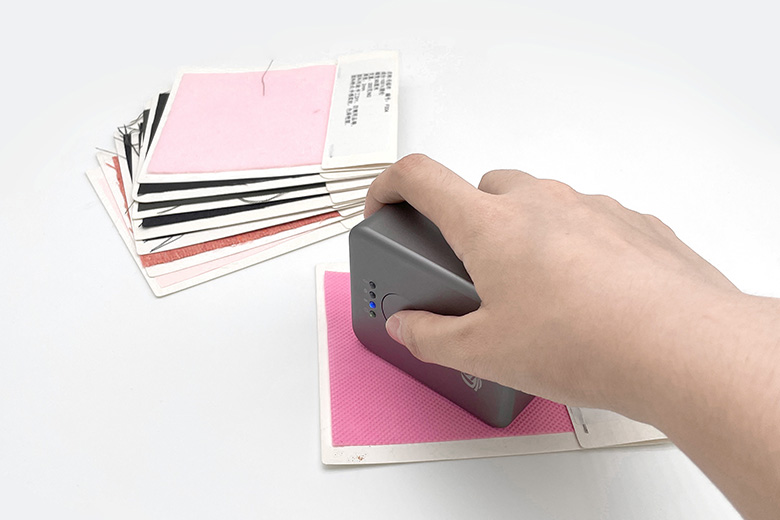
Fabric inspection
Qualitative or quantitative analysis of fabric composition and content ratios
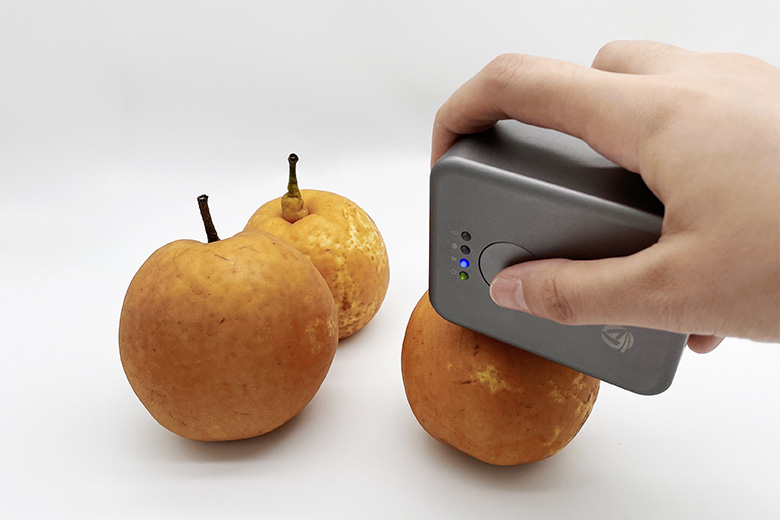
Fruit inspection
Quantitative analysis of quality indicators such as sugar content, moisture and freshness
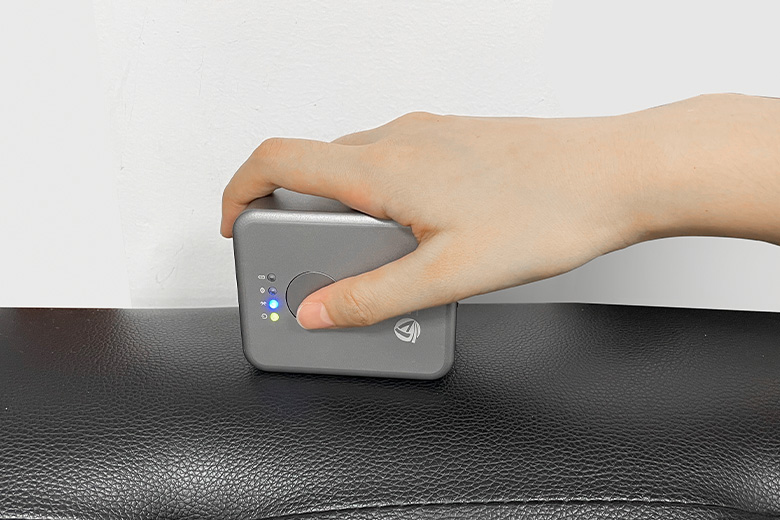
Leather identification
Qualitative analysis of leather composition with authenticity verification
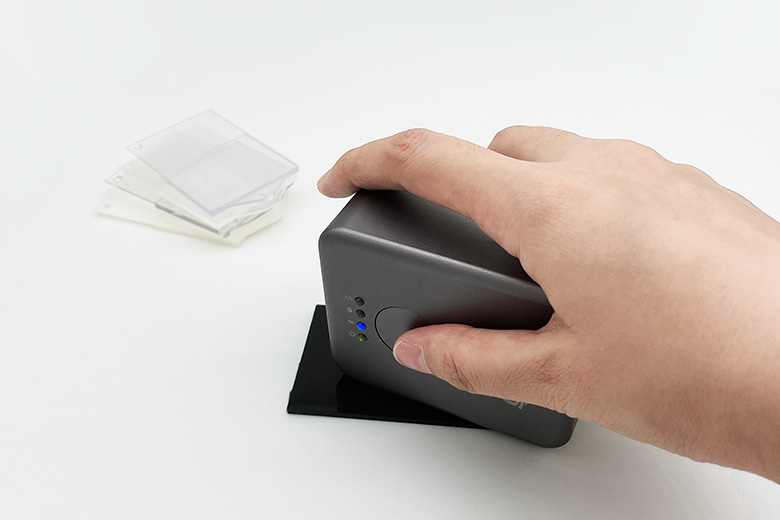
Plastic identification
Rapid qualitative identification of plastic composition, suitable for incoming material inspection
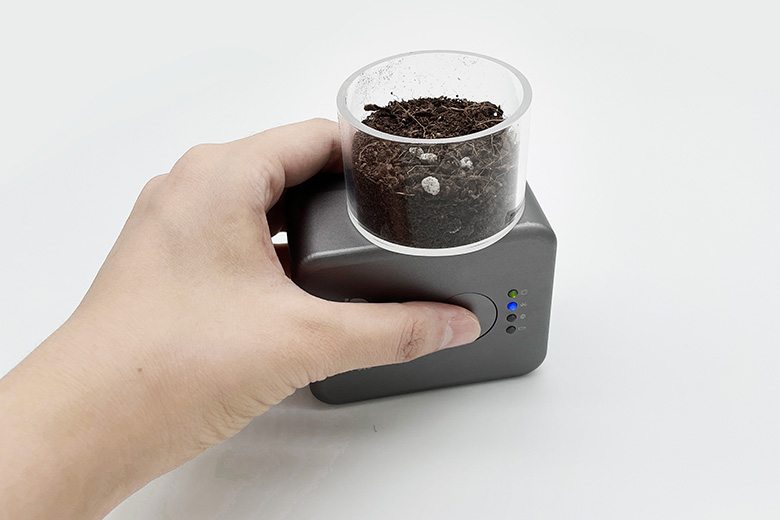
Soil analysis
Quantitative detection of soil fertility indicators; powder samples should be placed in a transparent quartz container
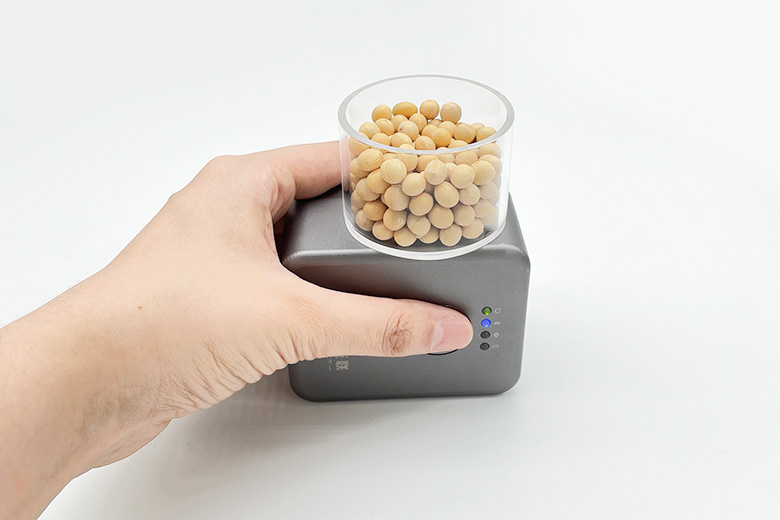
Grain inspection
Qualitative or quantitative analysis of grain quality components; granule samples should be placed in a transparent container
4. Typical Spectra
The spectra below illustrate the reflectance spectral characteristics or application-specific feature regions of common samples within the band covered by this model, and do not represent unit-by-unit measured data of this model.
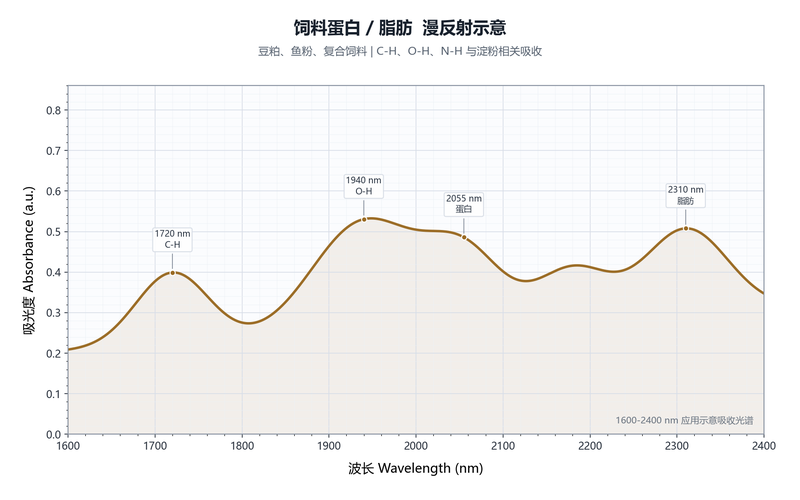
Feed protein and fat diffuse reflectance illustration
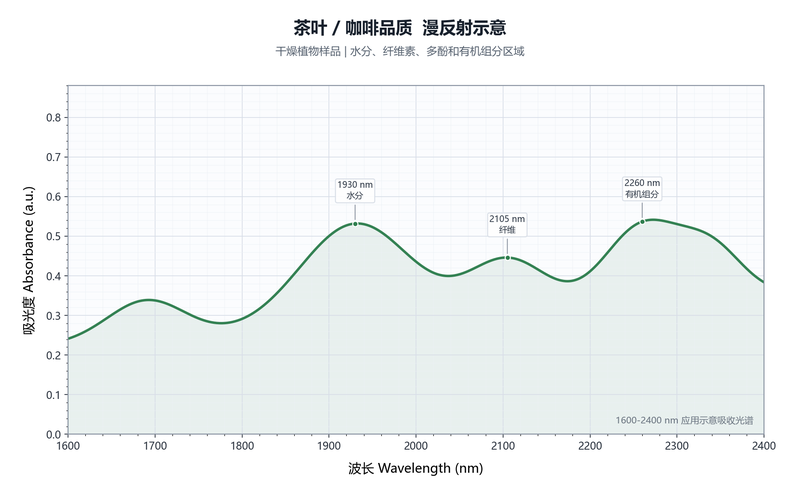
Tea and coffee quality diffuse reflectance illustration
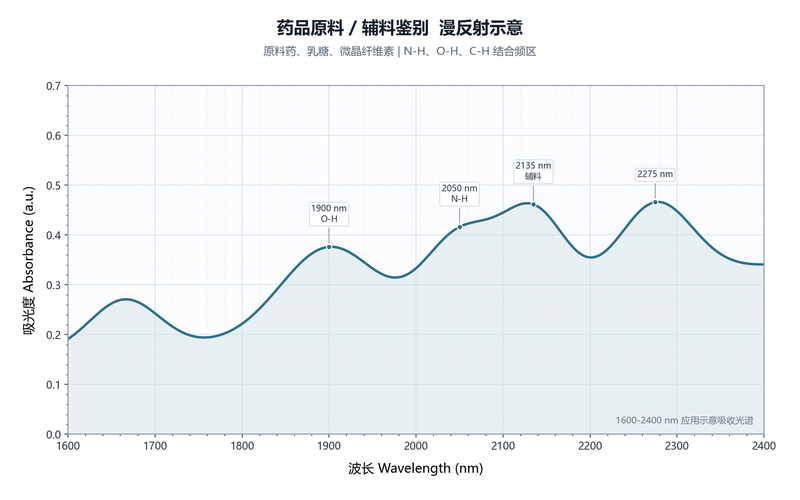
Drug API and excipient identification diffuse reflectance illustration
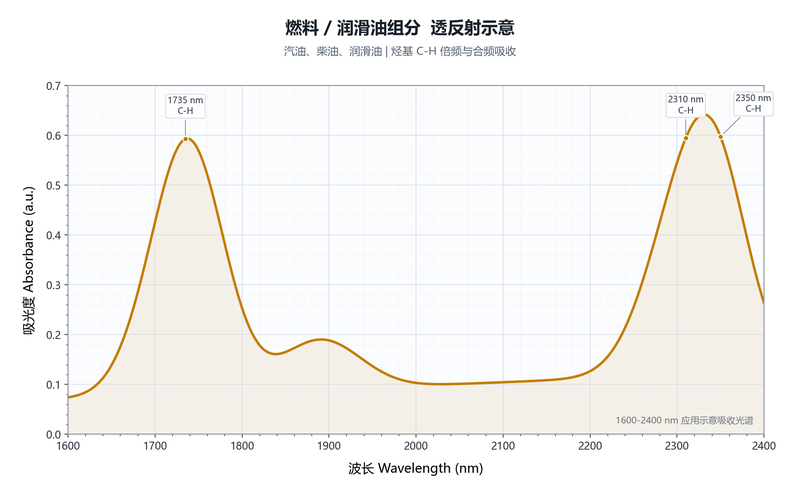
Fuel and lubricant component transflectance illustration
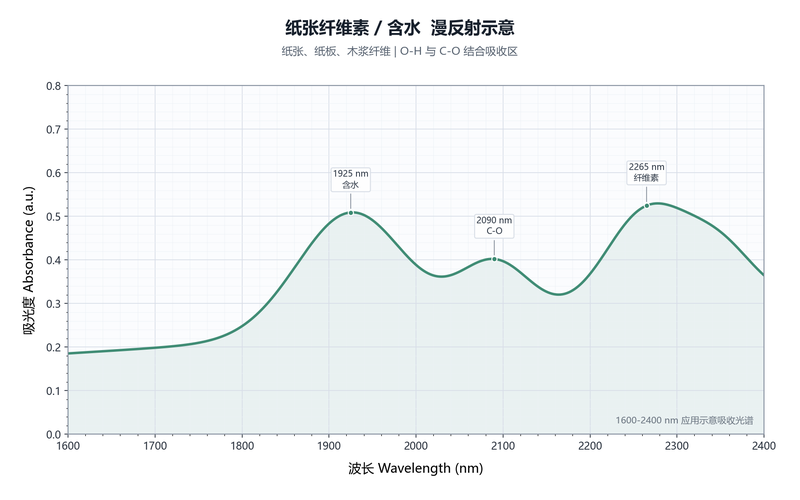
Paper cellulose moisture diffuse reflectance illustration
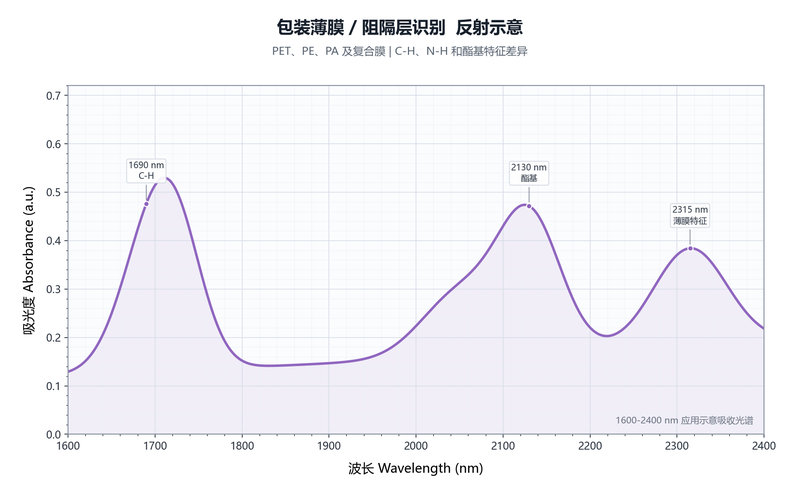
Packaging film barrier-layer identification reflectance illustration
5. Ordering Information
| Product Name | Model | Quantity | Unit Price | Amount (CNY) |
|---|---|---|---|---|
| Reflectance-type near-infrared spectrometer | NIR-R320 | 1 | 55800 | 55800 |
| Standard reference whiteboard | STD-DR100 | 1 | 950 | 950 |
| Total | 56750 |
The prices above are for website selection display. Actual quotes will be adjusted according to enclosure, interface, software, accessories, calibration and batch quantity; the official purchase shall be based on the sales quotation.
6. Technical Principle
6.1 Chemical Principle
Near-infrared spectroscopy is a molecular vibrational spectroscopy. Fundamental molecular vibrations lie mainly in the mid-infrared region, while overtone and combination transitions fall into the 700-2500nm near-infrared region. This product covers the 1600-2400nm band and can capture the characteristic absorption information of hydrogen-containing groups such as O-H, C-H and N-H, making it suitable for qualitative identification, content prediction and process monitoring when combined with chemometric models.
Near-infrared spectra usually do not rely on a single peak but model absorption features across multiple bands. In practice, preprocessing and modeling methods such as smoothing, normalization, SNV, first derivative, second derivative, MSC or PLS are commonly used to reduce the effects of sample morphology, optical-path differences, scattering and temperature drift.
6.2 Optical Principle
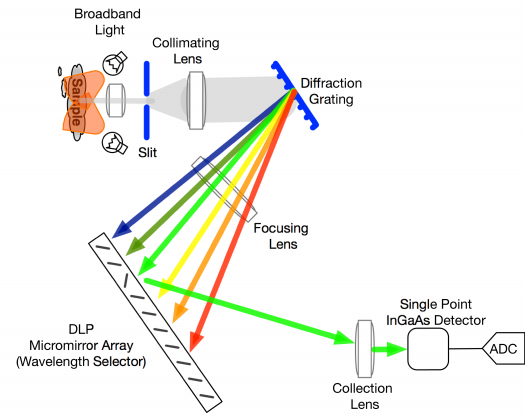
Reflectance-type products fix the light source, scanning window and receiving optical path inside the unit structure. After the sample is illuminated, the diffuse reflectance signal enters the DLP spectral core for wavelength selection and InGaAs detection, making it suitable for opaque solids, powders, granules and sheet samples.
This series of near-infrared spectral products is based on DLP spectral architecture with a grating-based dispersive design. Light passes through the slit and is collimated onto the grating (diffraction); the light of different wavelengths dispersed by the grating is then directed side-by-side onto the digital micromirror array (DLP). By programming each micromirror, light of the corresponding wavelength is reflected in sequence onto a single-point InGaAs detector, then converted to a digital signal by the ADC and resolved into a spectral curve. The schematic is as follows:
6.3 Measurement Principle
Reflectance-type units typically first acquire a reference spectrum from a whiteboard or standard reference surface, then place the sampling window close to the sample surface to acquire the sample spectrum; the software calculates reflectance or absorbance accordingly. For granules, powders and samples with uneven texture, multi-point acquisition and averaging are recommended to reduce fluctuations caused by local differences.
7. Usage Guide
7.1 Software Usage
- Establish a connection with a computer, tablet or customer device via Type-C or Bluetooth, and confirm normal communication before starting acquisition.
- After powering on, first warm up the light source and acquire a reference spectrum using the standard whiteboard before measuring the sample.
- For non-uniform samples, acquire multiple positions consecutively and average them to improve model stability.
7.2 Precautions
- Keep the sampling window and whiteboard clean to avoid stains, scratches and dust affecting the reflectance baseline.
- During measurement, keep the window flush with the sample surface or keep the working distance consistent to reduce ambient light leakage.
- For powder, granule and tablet samples, keep the loading thickness, compaction method and container material consistent.
- In battery-powered scenarios, charge in time before the battery is low to avoid fluctuations in light-source intensity and communication stability.
7.3 FAQ
Q1: Does the reflectance-type product need a whiteboard reference every time?
A: It is recommended to re-acquire the whiteboard reference after power-on, after environmental changes, or before changing sample batches to ensure stable reflectance and absorbance calculation.
Q2: How do I choose among the R210, R310 and R320?
A: The three mainly differ in wavelength range and the absorption feature regions of the target samples. The short-wave band suits common moisture, sugar and agricultural-product scenarios, while the mid-to-long-wave bands are better suited to fat, protein, material and complex organic component analysis.